
Commissioned research for Jinmao Group · CitoryTech · 2020
My role: Project lead; founder and research director of CitoryTech.
The question
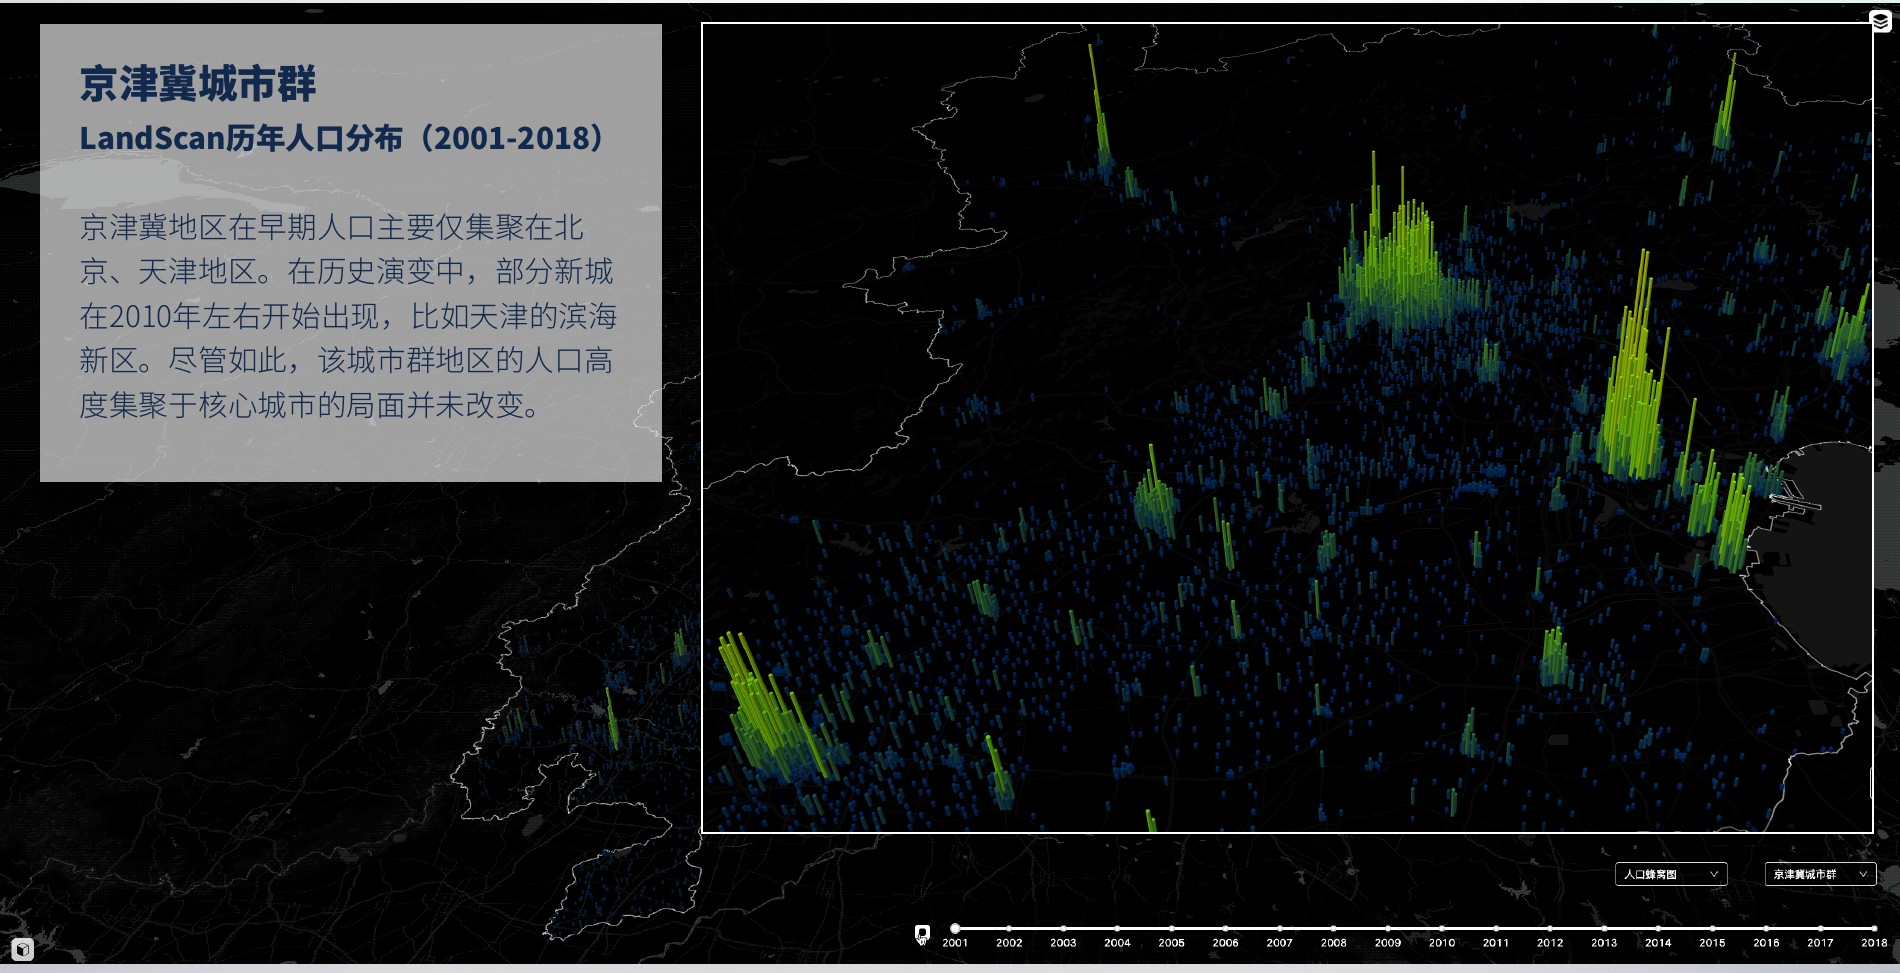
Where were people concentrating, where was urban land expanding, and how closely did these changes align? I led this consulting project at CitoryTech to compare the development trajectories of five major Chinese city regions: Beijing–Tianjin–Hebei, the Yangtze River Delta, the Pearl River Delta, Chengdu–Chongqing, and the middle reaches of the Yangtze River.
The study connected a national view of population distribution with comparisons among cities, their urban cores, and surrounding areas. It gave the client a common analytical framework for examining regional differences in urban growth.
Data and approach
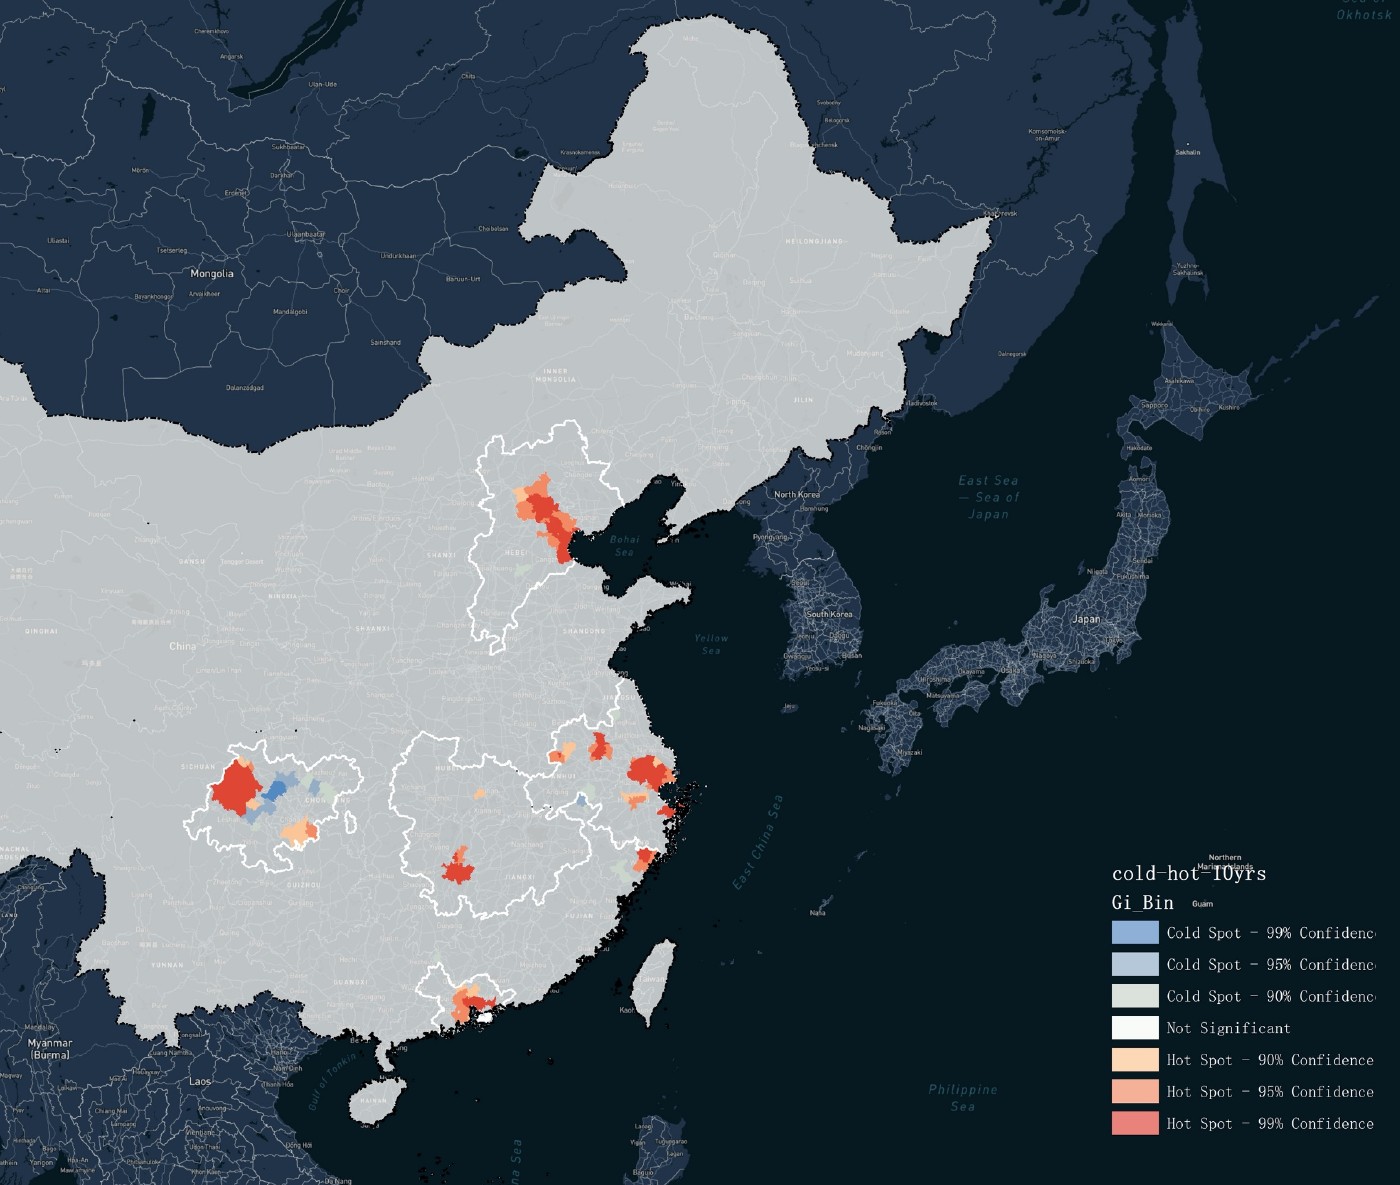
Our team combined LandScan population grids with DMSP/VIIRS night-time light data. The report examined population change over 2000–2018 and light-derived built-up-area change over 1992–2016. Regional maps, population cartograms, growth comparisons, and spatial hot-spot analysis offered complementary views of the same urban systems.
| Analytical step | What it revealed |
|---|---|
| Population distribution and change | Concentrations of people and areas of growth or decline |
| Comparisons within city regions | Differences between core cities and surrounding places |
| Built-up-area trajectories | The timing and extent of urban land expansion |
| Population–land comparison | Places where population and land growth followed different paths |
Comparing growth trajectories
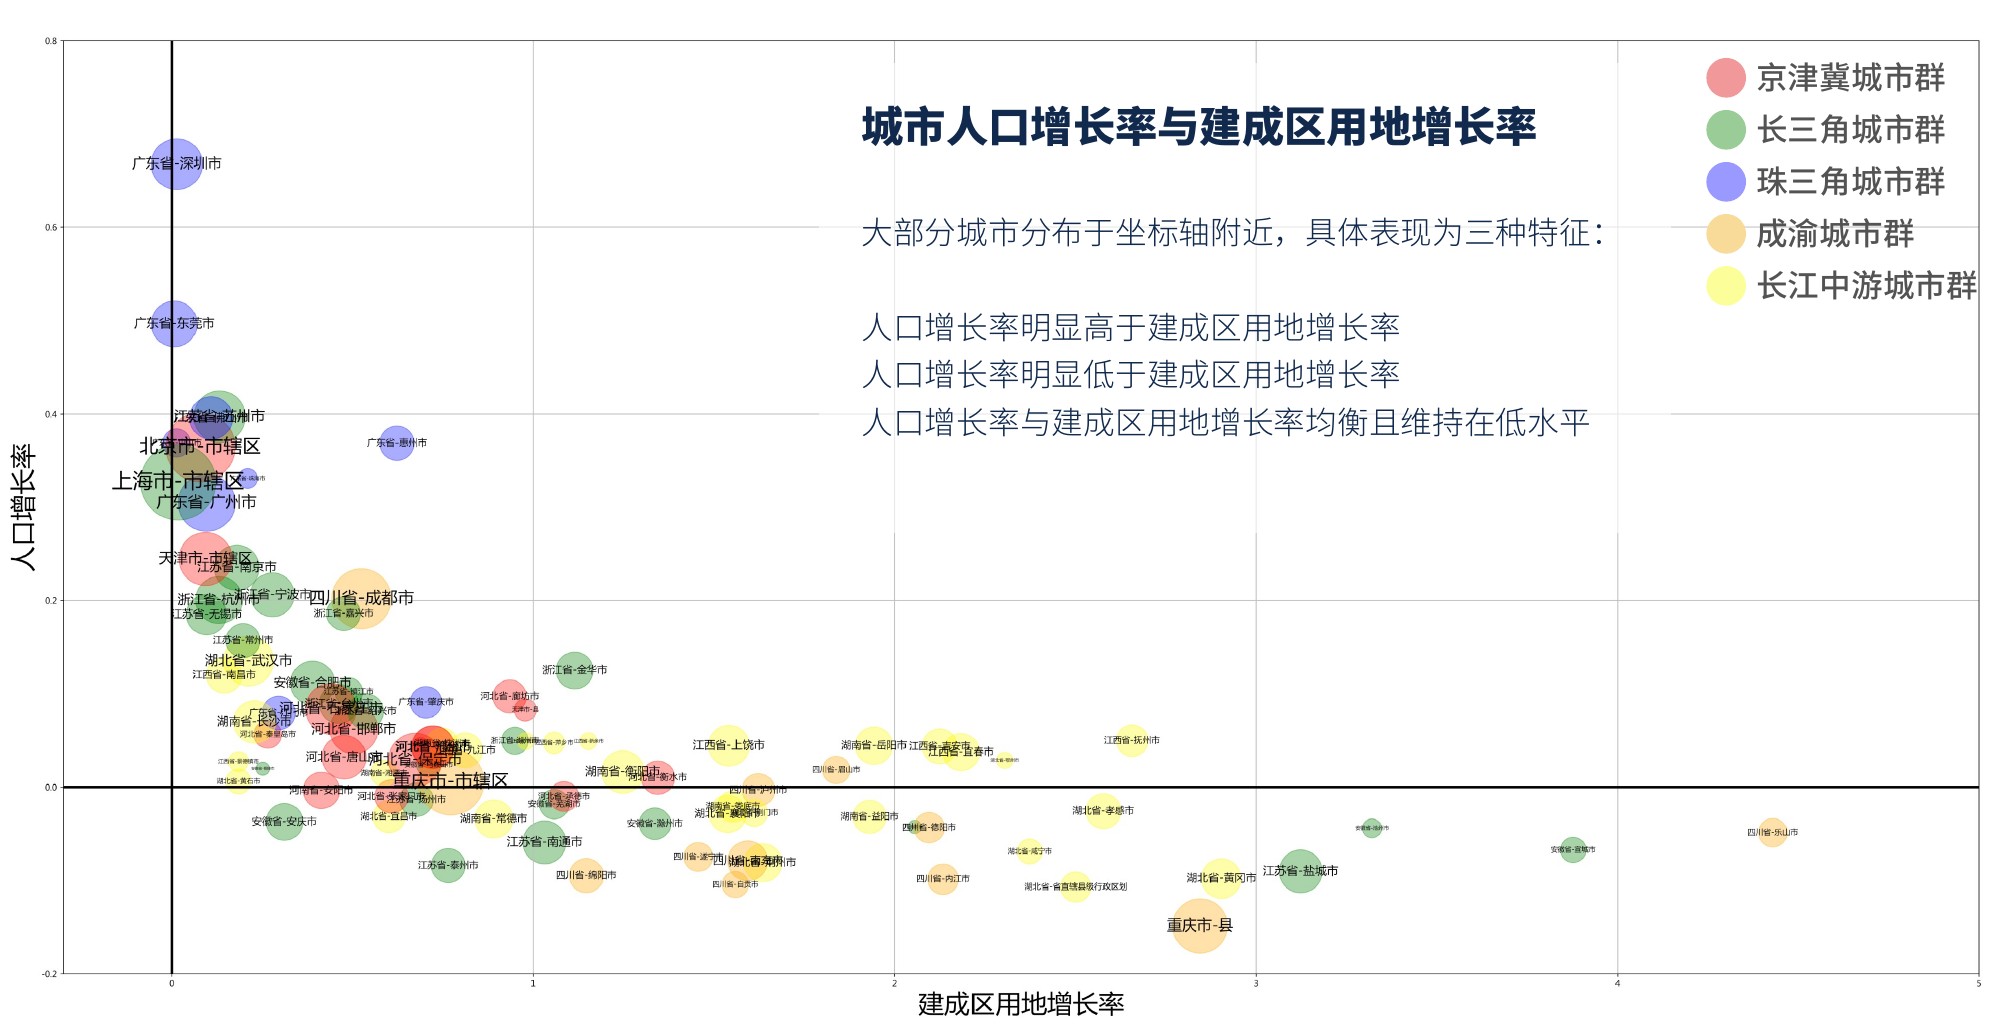
The analysis identified distinct patterns: population concentration with relatively limited land expansion, land expansion outpacing population growth, and more balanced growth at lower rates. These comparisons made it possible to examine variation within a city region alongside differences between regions.
My role and project output
I led the CitoryTech team’s work on this project. The output was a comparative research report supported by maps and visual analysis, bringing population change, urban expansion, and regional structure into one discussion for the client.
The figures document the historical study delivered in 2020. Population grids and night-time lights are estimates of spatial conditions; their comparison describes patterns of change rather than establishing that land development caused population growth.
Figures: CitoryTech project report, 2020. Related work: National Mobility Networks in China, which examines regional connections through population movement.