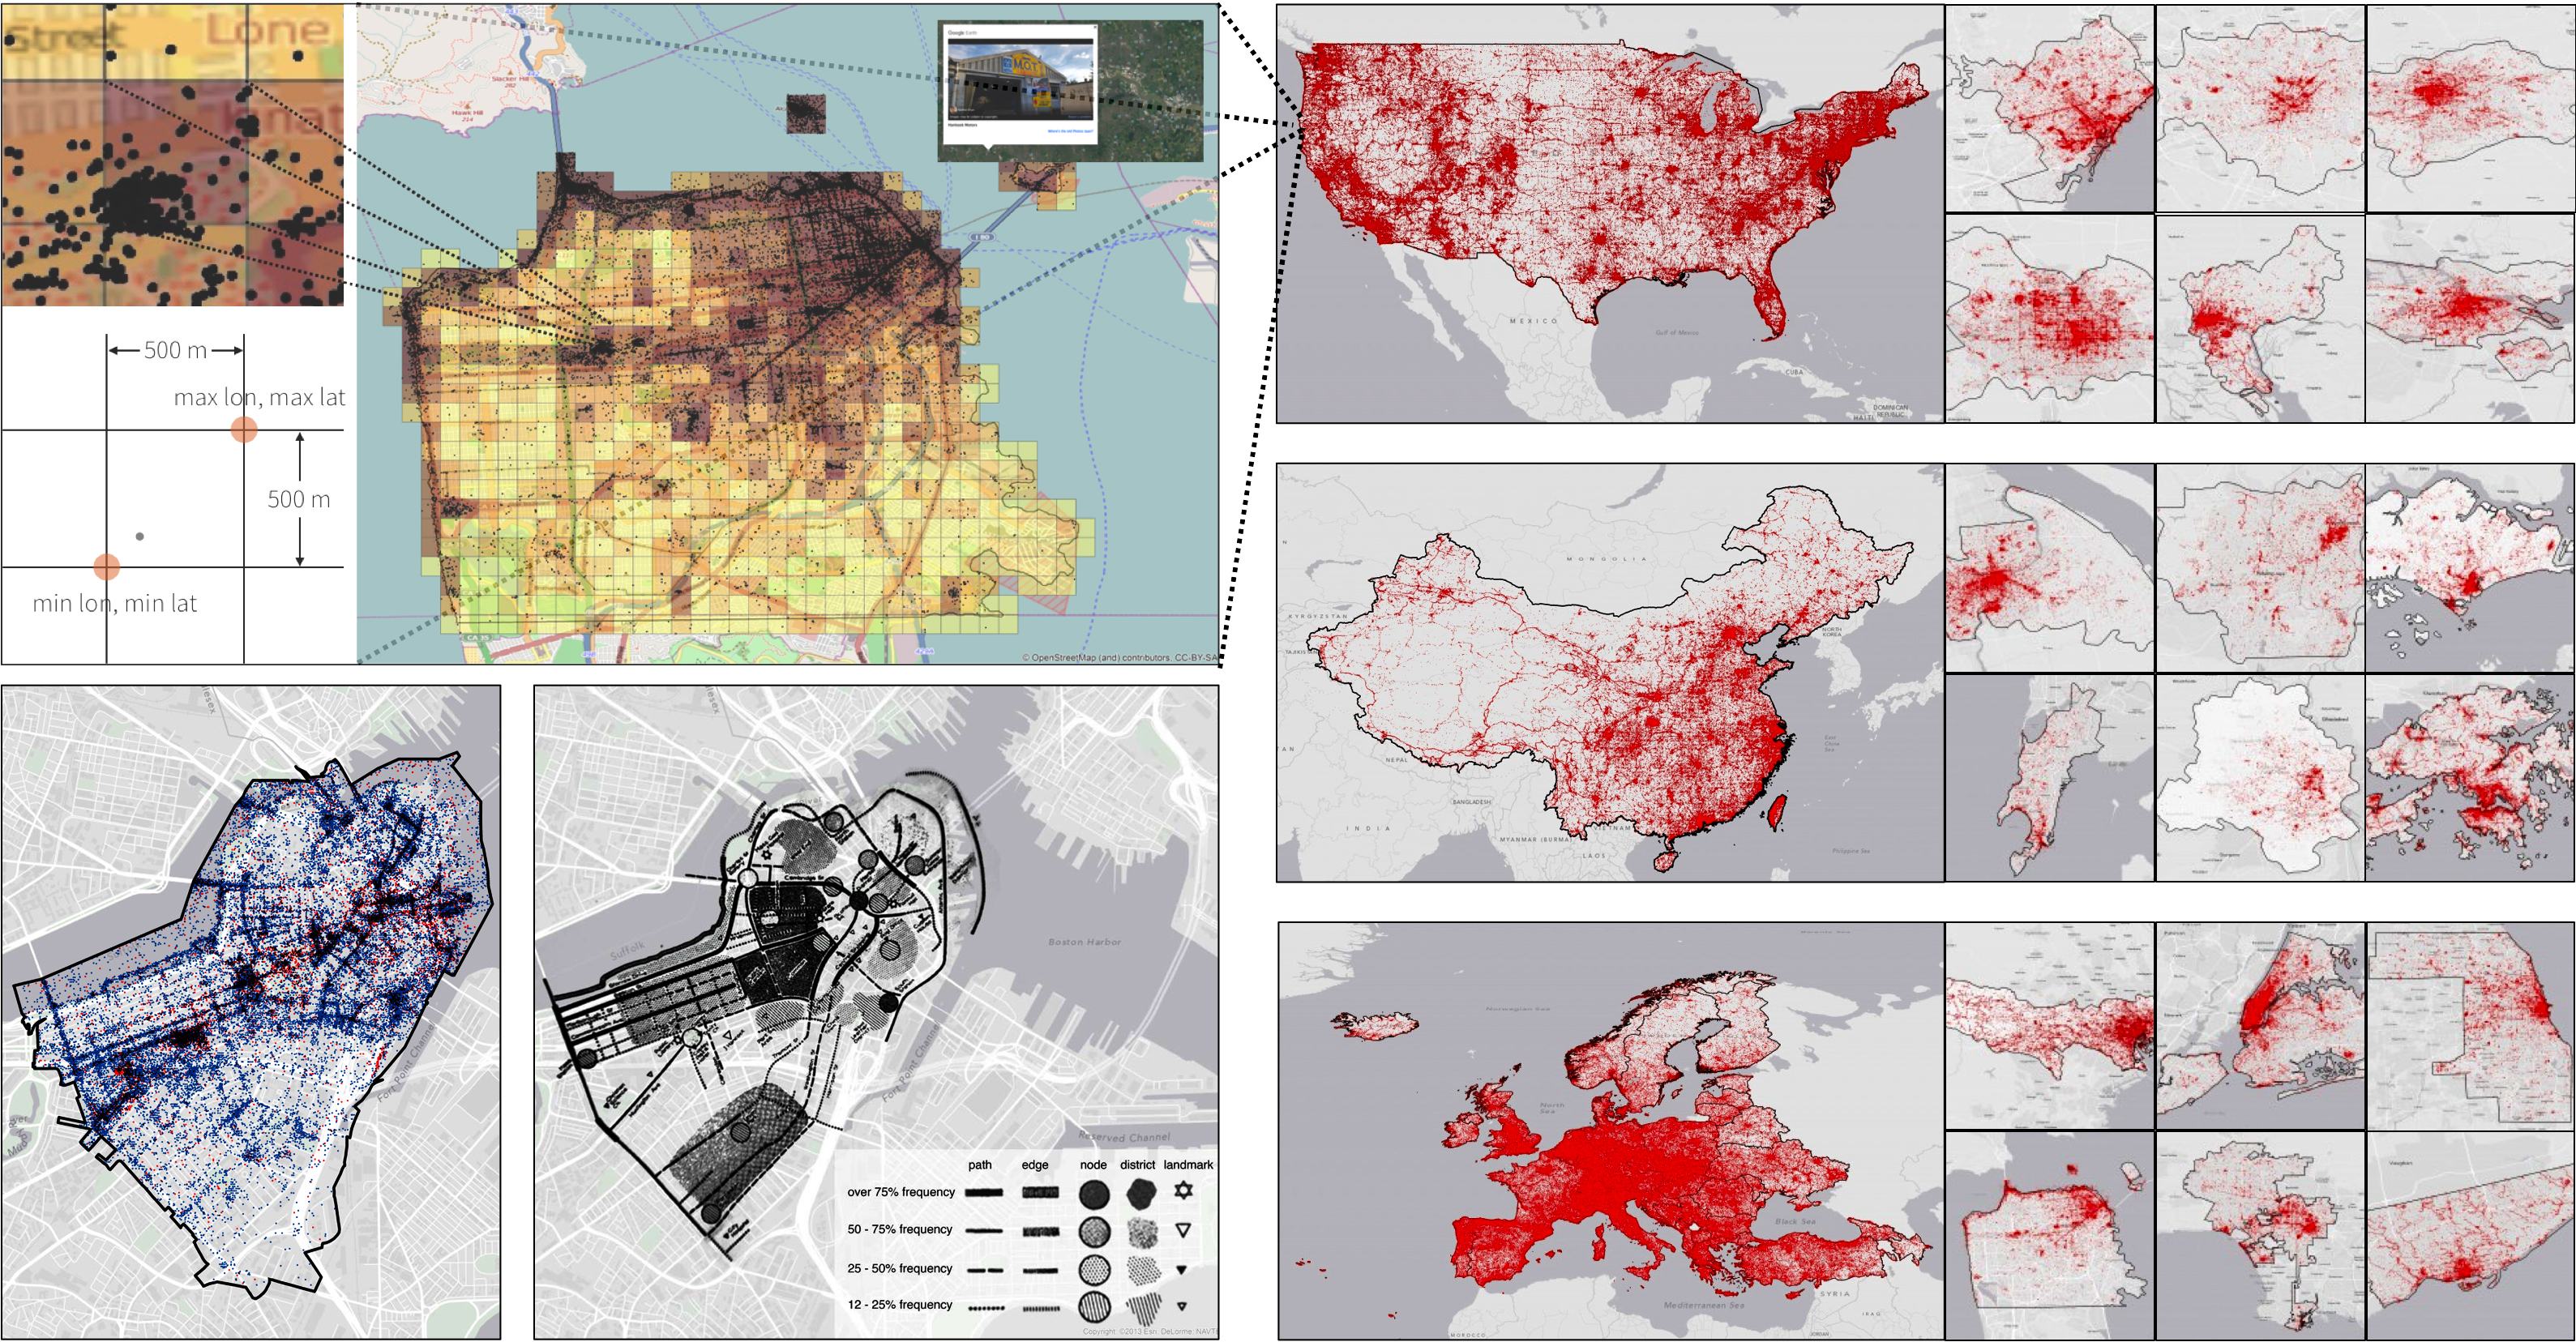
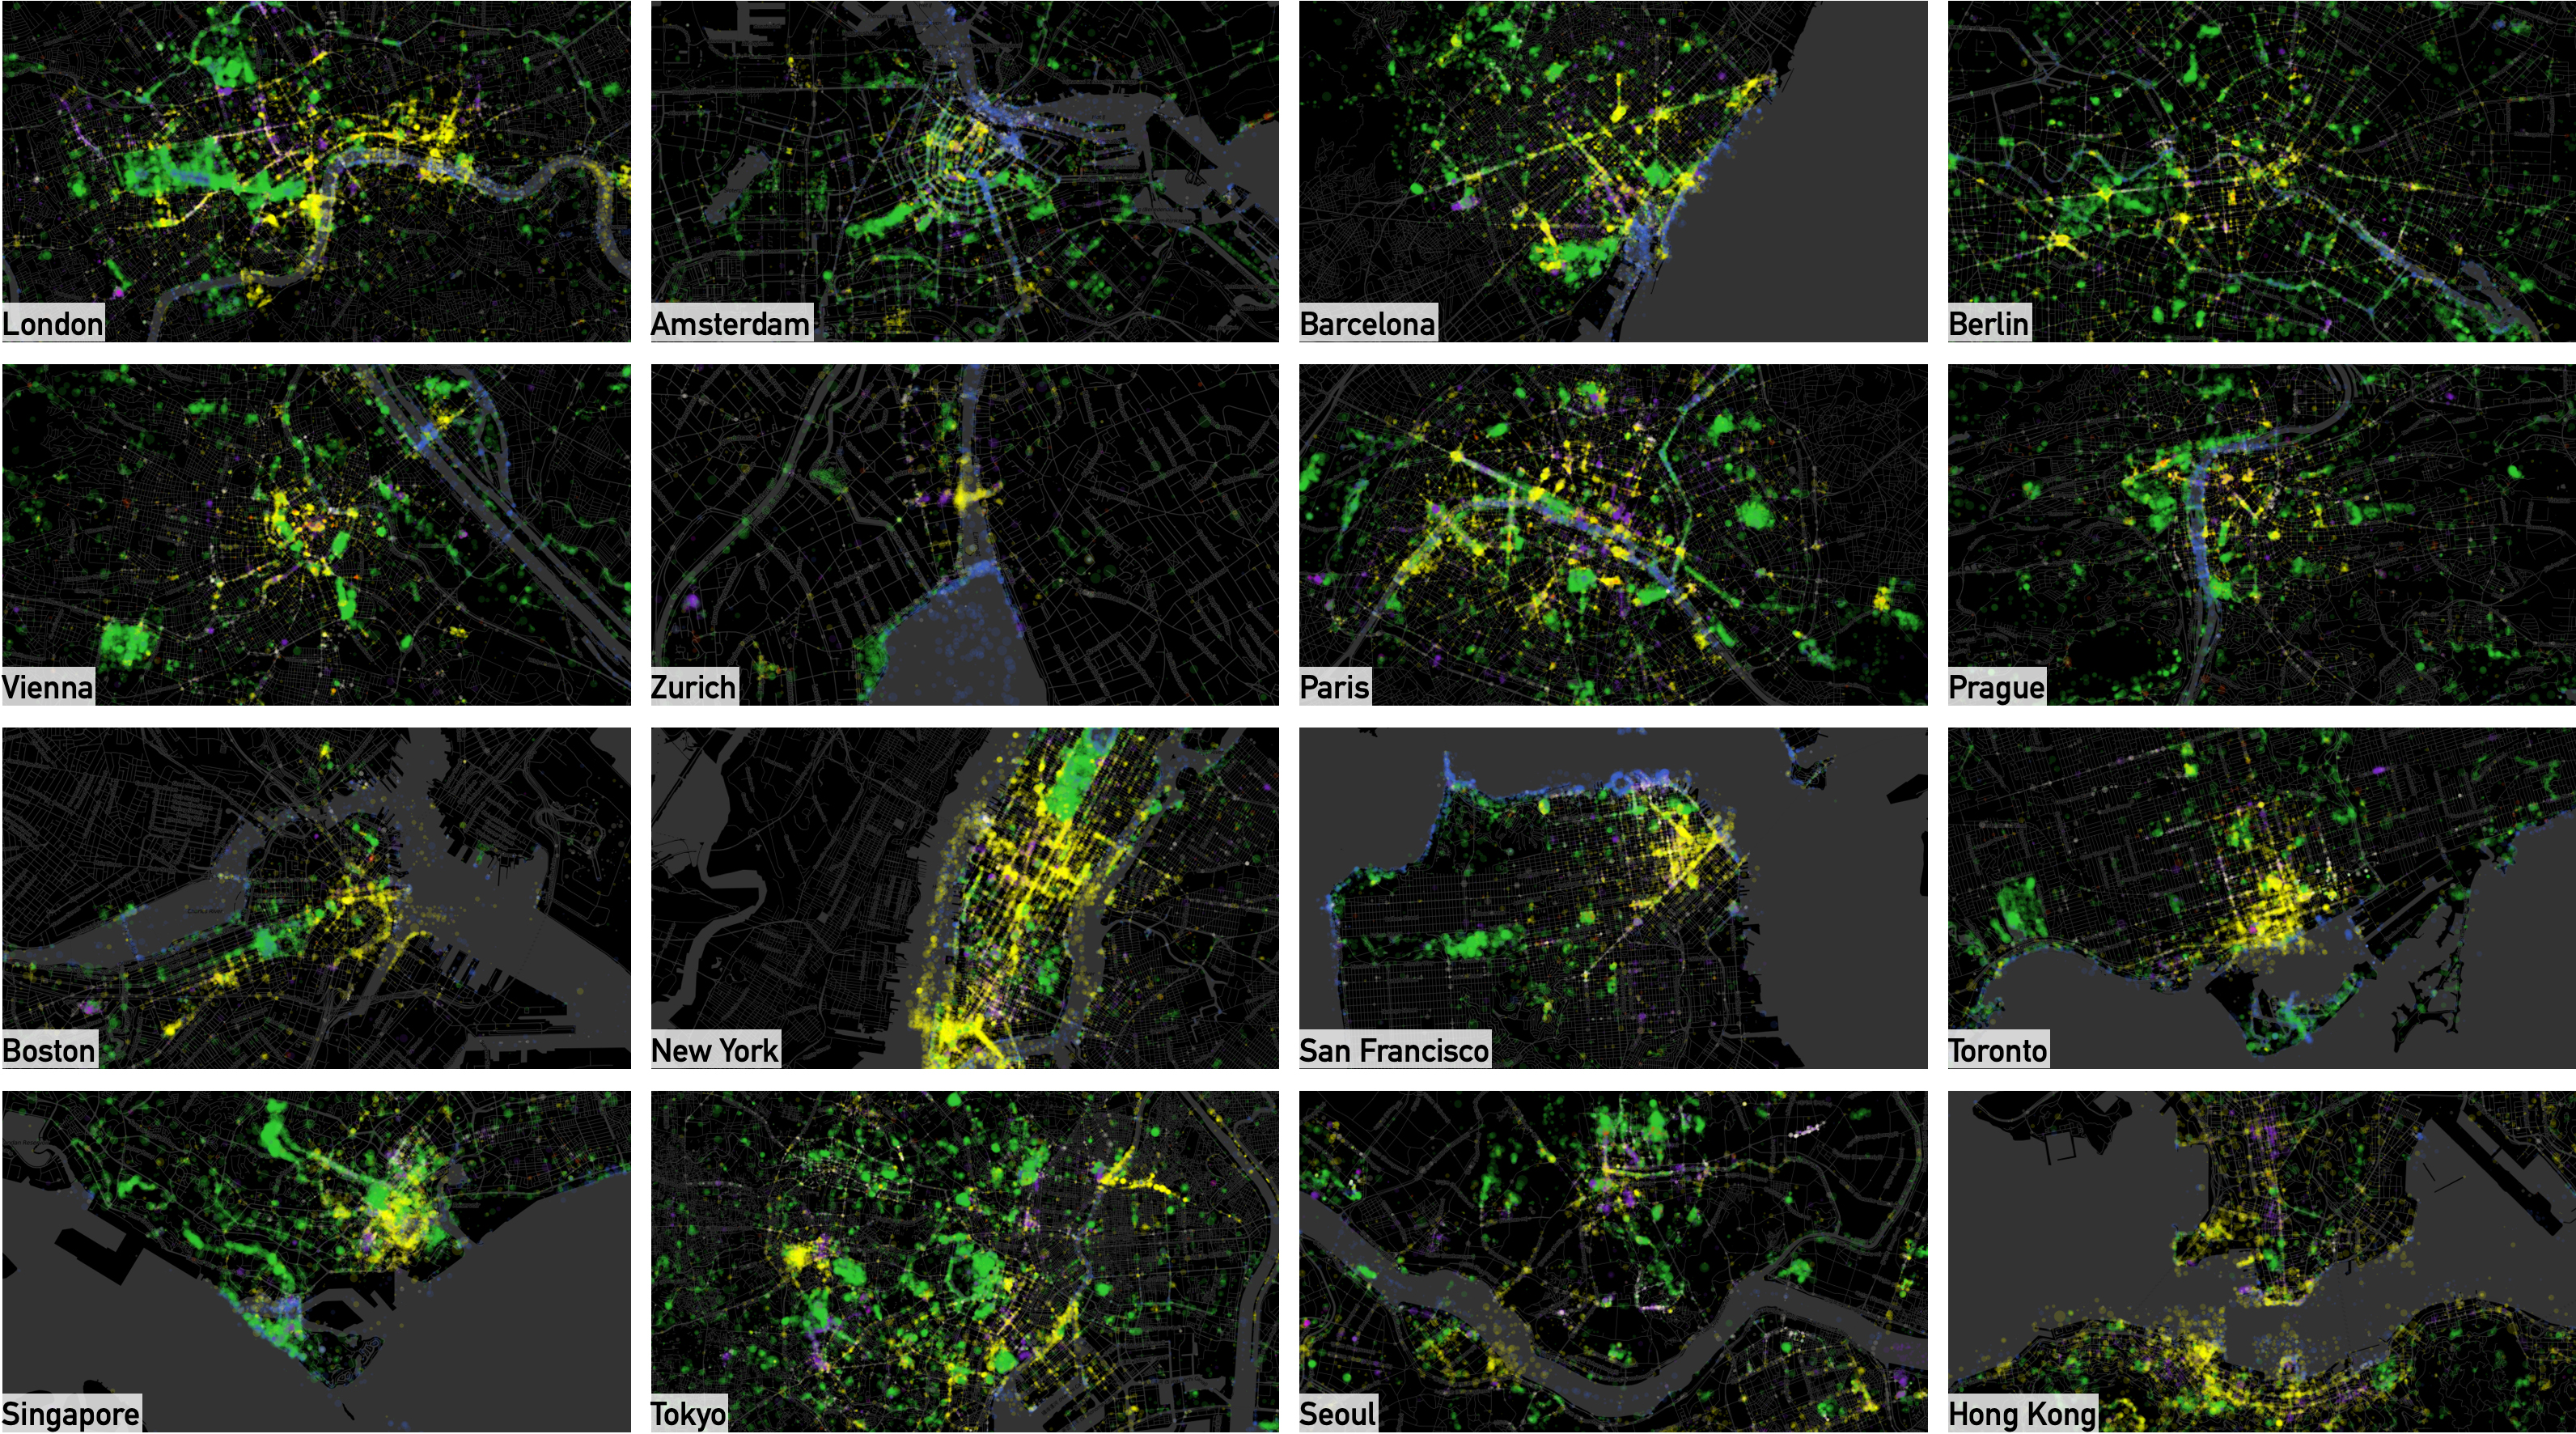
This project originated from my thesis, which involved the collection of millions of photos from 26 cities. The objective was to utilize deep learning techniques to conduct scene recognition on these images. By categorizing the data and plotting the seven critical perceptions, the resulting perceptional maps provide insights into how inhabitants perceive their living environment within each city.
# Interactive Maps
Below are interactive maps of the original C-IMAGE cities (recovered from my archive): Amsterdam, Bangkok, Barcelona, Beijing, Hong Kong, Kuala Lumpur, London, New Delhi, New York, Paris, Prague, San Francisco, Seoul, Shanghai, Singapore, Tokyo, Toronto, Vienna, Zurich
# The Idea
Half a century ago, Kevin Lynch’s City Image project provided a collaborative depiction of the “perceived city” by gathering input from the public through a method called “mental mapping.” Now, with the power of computer vision and the ability to leverage crowd-sourced geo-tagged photos, we can explore whether we can detect people’s sentiments towards their physical living environment. By analyzing these images using computer vision algorithms, we aim to gain insights into how individuals feel about their surroundings and further enhance our understanding of urban landscapes.

# Data Processing
The download of the Panoramio geo-tagged images are through Pranoramio data API and Flickr API.

# Scene Classification
The images are classified based on Places 365. For this study, I selected Panoramio and, subsequently, Flickr as the primary sources for data collection. Approximately 30 million photographs were gathered by the completion of the project. The geographical spread of these photos offers a unique perspective, allowing for a comparison with the urban image as conceptualized by Kevin Lynch, which was derived from a multitude of cognitive maps.

# Mapping the Perceptions
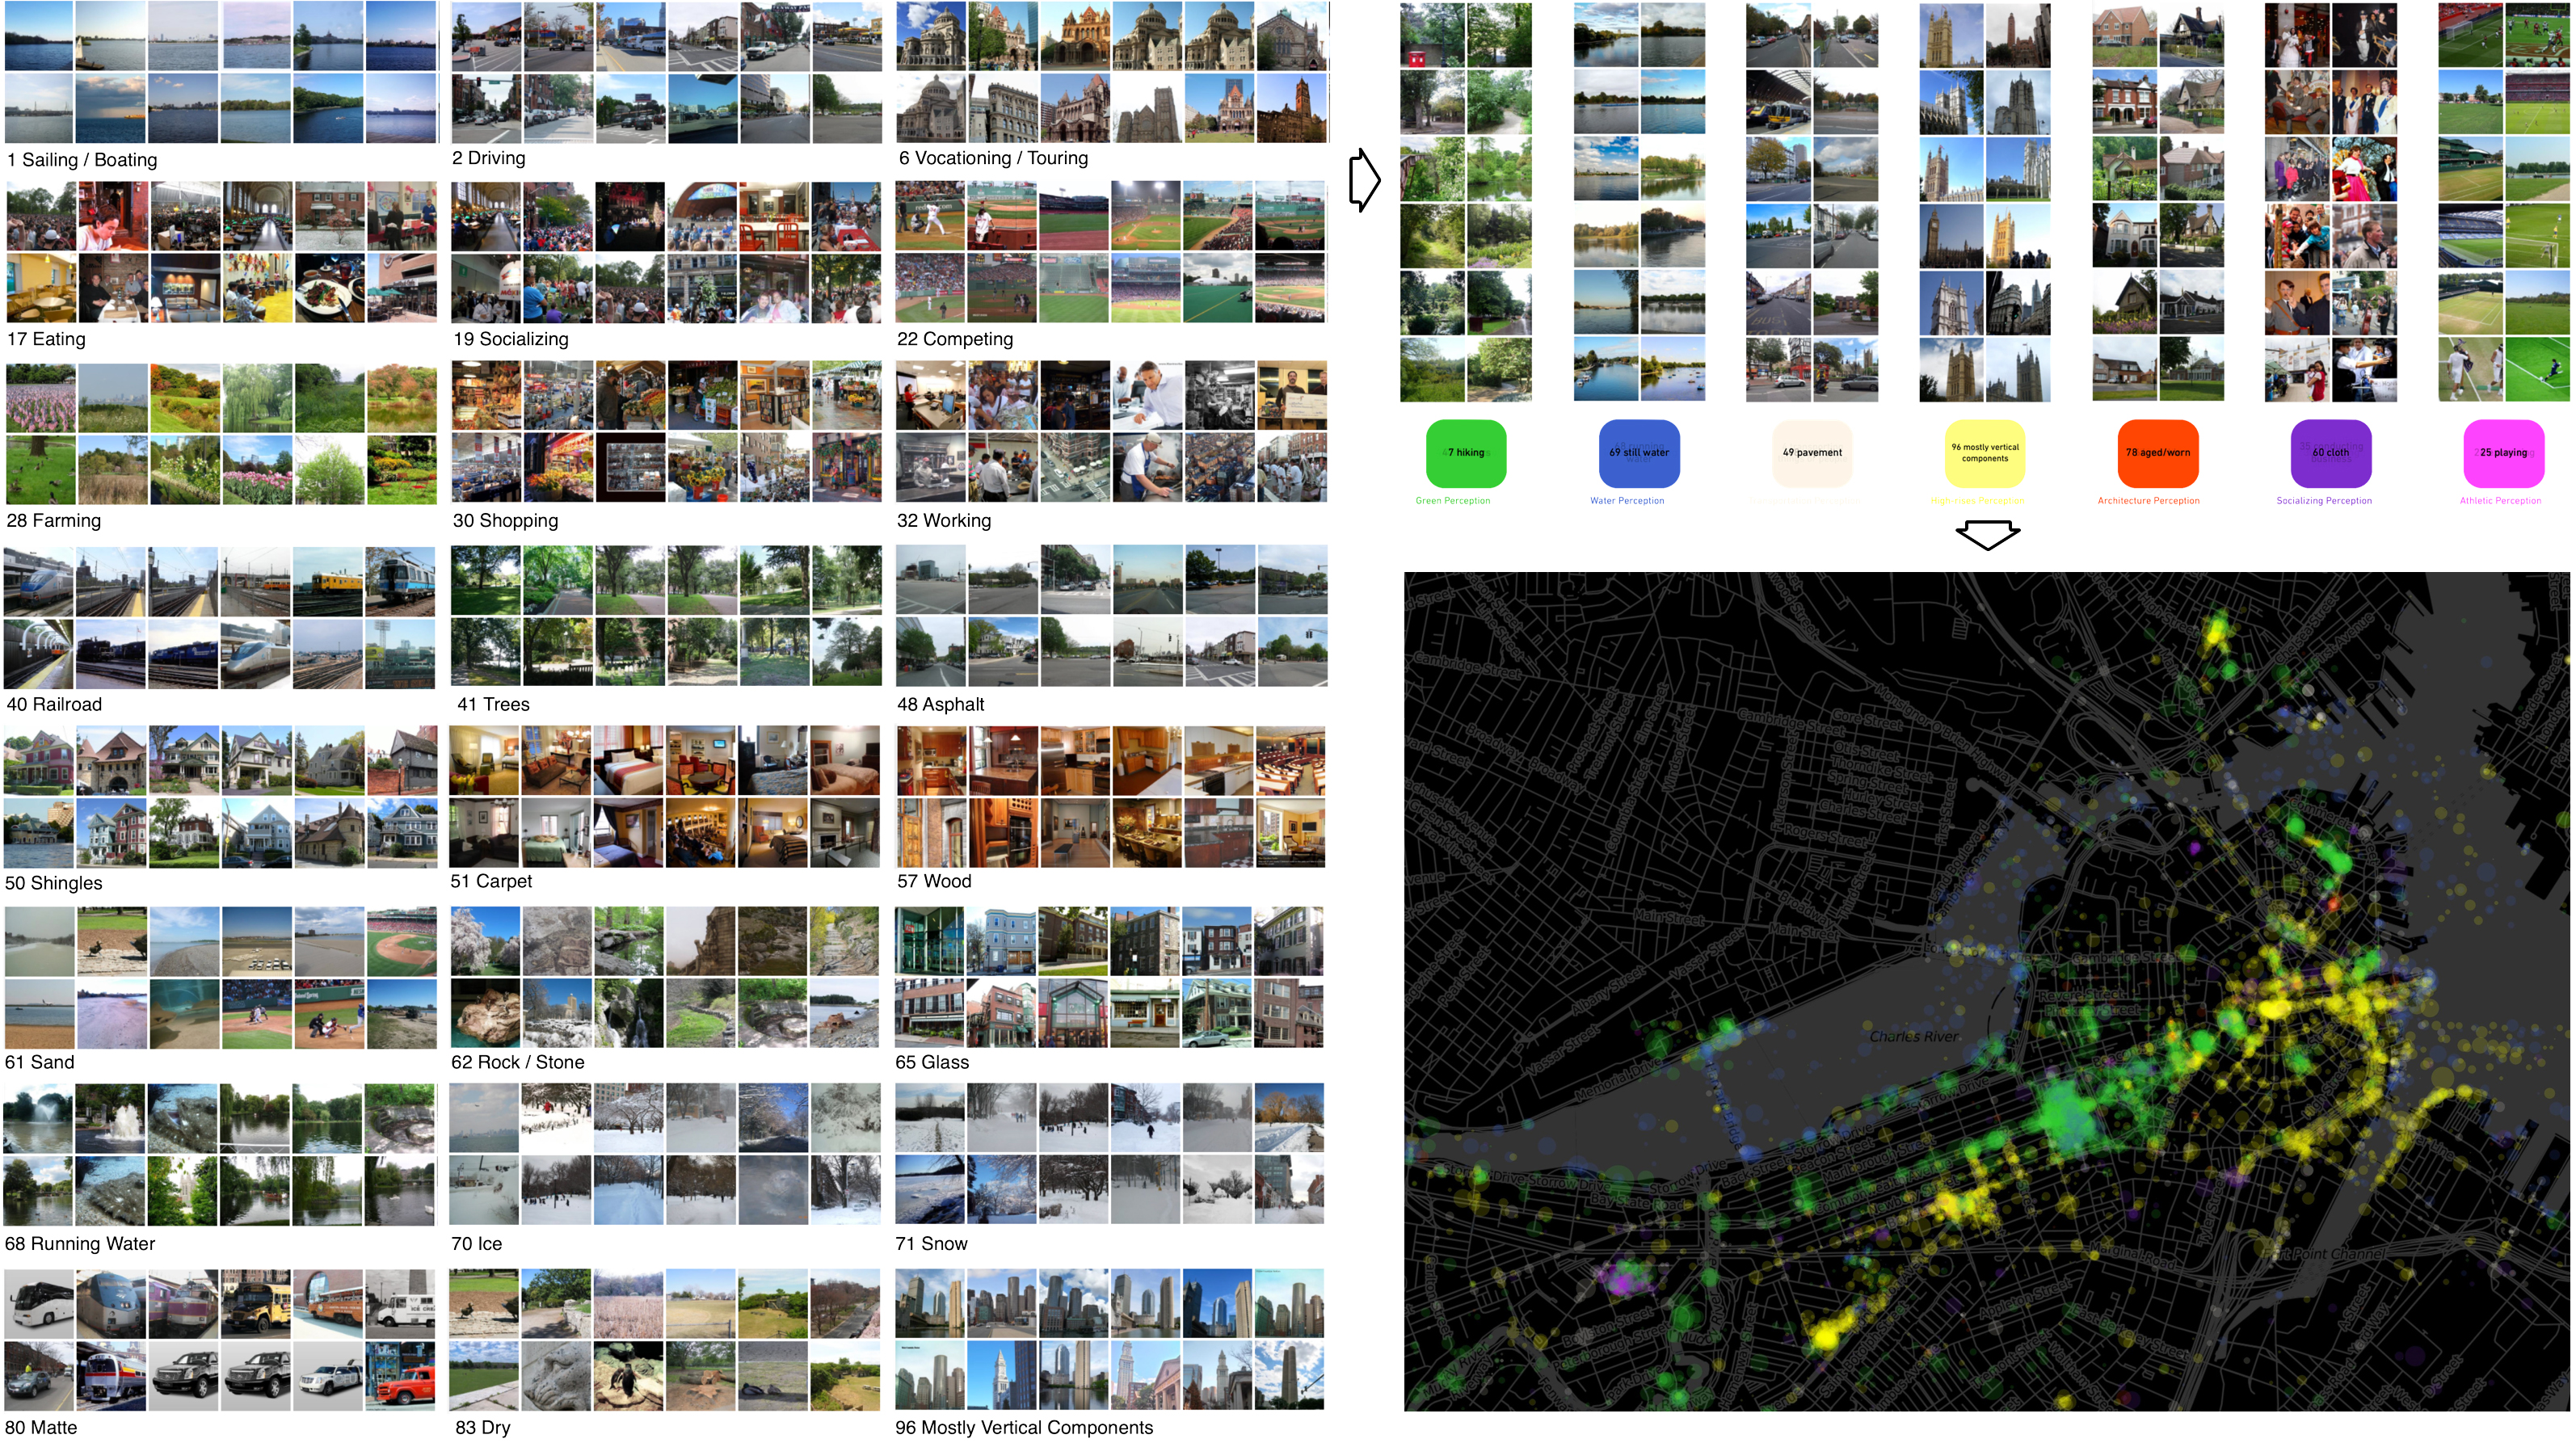
After being processed through scene recognition, currently called Places365, the photos were categorized into 102 attributes. I subsequently conducted a reclassification, streamlining the images to form a generalized portrayal of the city’s public image. This led to retaining only those scenes that are associated with public spaces.
By retaining only seven critical perceptions and plotting them on city maps, we can observe varying city patterns that truly reflect what the inhabitants “see.” This approach allows for fascinating discoveries that can be evaluated qualitatively and quantitatively. For instance, a comparison can be made between the perception of green spaces in Shanghai and Tokyo.

# Other Cases
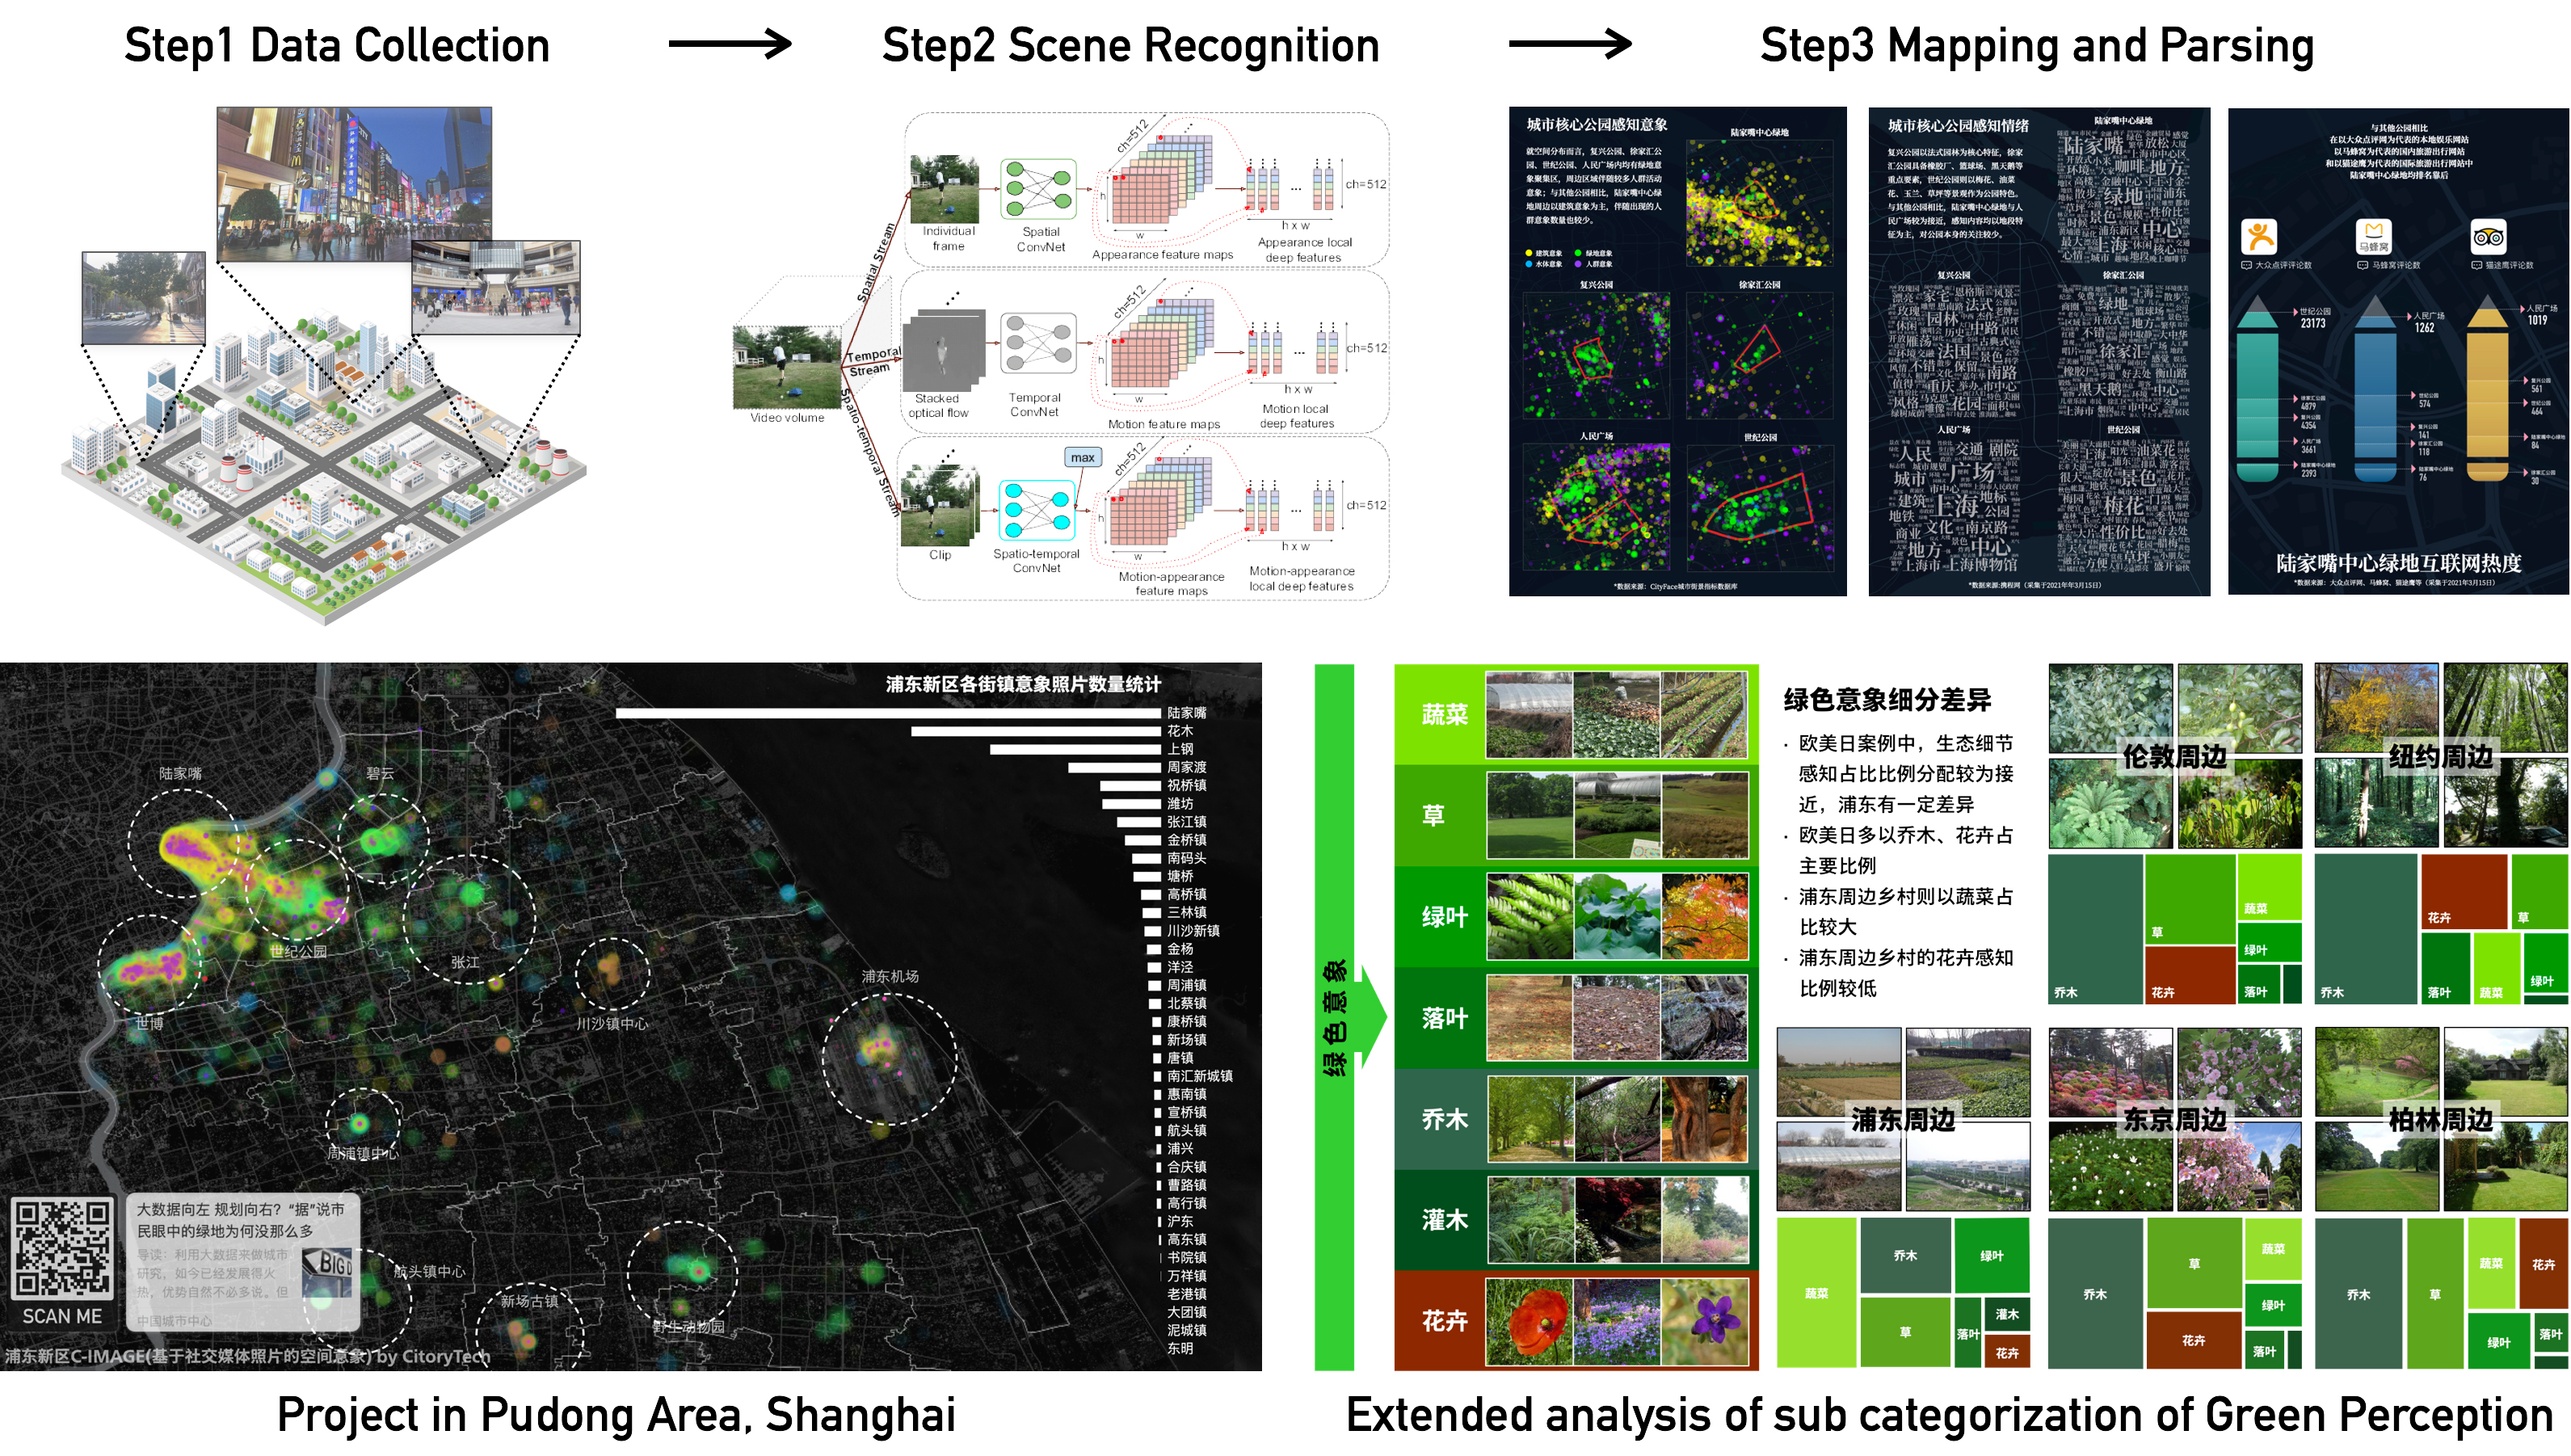
This method is highly replicable and has been employed in various real-world projects following a relatively fixed procedure. Additionally, the critical perceptions can be broken down into more specific categories. For instance, I divided the green perception into seven sub-elements, which led to discoveries.

# Demo Video
Below is a demo video showing the distribution of image classification results in Shenzhen.